
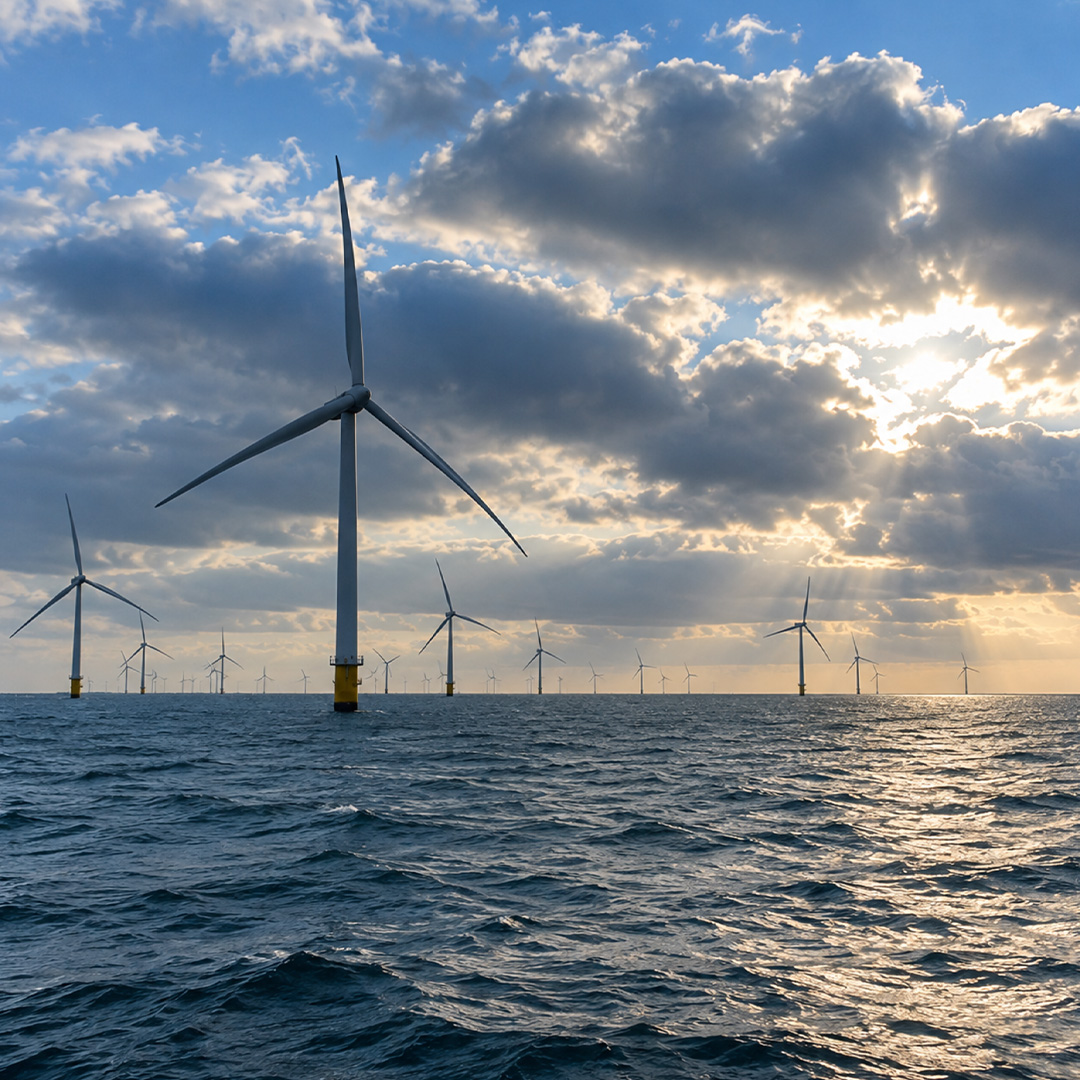
Wind Outweighs Rising Gas
14..10.2026
Short term
Power – Short-term:
Dutch day-ahead baseload prices fell sharply in Week 41, averaging €138.2/MWh, down €40.0/MWh week-on-week. Peak prices followed, averaging €131.3/MWh (−€41.0/MWh). The decline came despite stronger gas prices, with day-ahead TTF rising €4.6/MWh to €77.4/MWh and climbing steadily throughout the week. So the move was driven by renewables rather than fuel costs. Solar output was slightly lower than in Week 40 across the Netherlands and neighbouring countries, but this was outweighed by a strong increase in wind from Thursday onwards. Tuesday and Wednesday still cleared above the previous week, but prices dropped steeply once the wind picked up. Saturday was the lowest day at €50.7/MWh, nearly €120/MWh below the previous Saturday, before prices partly recovered on Sunday. On the supply side, Eemshaven 6 (approximately a size of 350 MW) went into an extended outage from 7 October, expected to last until mid-December.
Gas – Short-term:
TTF prices rose in Week 41, averaging €77.2/MWh, up €4.7/MWh week-on-week. Prices firmed steadily through the week, driven by renewed Middle East risk as the market kept a close eye on flows through the Strait of Hormuz. The November contract climbed back to its highest level since late September, reversing much of the easing seen in the preceding weeks.
Electricity (€/MWh)
Gas (€/MWh)
Long term
Forward curves moved higher across the board as ongoing geopolitical risk around the Strait of Hormuz lifted the whole fuel complex. TTF rose sharply at the front, while gains faded with a curve that was mostly flat from CAL-29 onwards. Similar to gas, Brent and coal had an upward price movement.
Base NL and Base DE followed because gas-fired plants set the price in most hours, so higher fuel and carbon costs pass directly into power. For NOV-26, the €15.1/MWh rise in Base NL closely matches the extra running cost of a typical gas plant, while further out the power gains shrank as the TTF increase faded. This uneven pass-through explains the mixed spreads. NOV-26 power fully absorbed the higher gas and carbon costs, so CSS Base firmed slightly. From DEC-26 through Q3-27 power lagged the cost increase, so CSS weakened, most clearly in summer, when renewables limit how often gas sets the price. CSS Base remains negative across most of the curve. Clean dark spreads strengthened at the front because coal rose much less than gas in relative terms.
Weekly changes
Base (€/MWh)
Peak (€/MWh)
Gas (€/MWh)
CO2 (€/MWh)
Aanmelden wekelijkse marktrapport
Vul hieronder uw gegevens in en ontvang gratis het wekelijkse marktrapport in uw mailbox.
Want to know more about us?
Contact us via our contact page or find out more about our company on the about us page.